A group project focusing on the research of advanced methods for human-computer interaction.
Project Overview
ShortCutters app is a CPSC444 course project and a group effort of 5, focusing on the advanced methodologies of human-computing interactions. This page shows the experiment report of this project along with the prototype. The main purpose of this study is UX research, the methods used to conduct user testing, and how to analyse the data produced to write a research report.
The detailed journal of the progress can be found in our blog.
A video introduction
My Role
To create responsive low to high fidelity prototype for a range of tests from cognitive walkthrough to experiment design, we opted for Justinmind to satisfy our prototyping and wire framing needs. I was responsible for the creation of various user interface design, iterations of workflow design, storyboarding and experiment design with data analysis tools.
Experiment Report
1. Introduction
Getting around in a city in style is becoming more and more popular around young generations. We see various kinds of applications providing this type of functionalities come on the stage from time to time, ranging from carpooling applications that allow different people to easily share ride with each other depending on the need, to smart navigation apps that crowdsources real-time data from drivers to personalize best possible routes. Our prototype is about a crowdsourcing navigation app that offers personalized routes choosing experience in a social setting. Current popular navigation apps like Google Maps and Waze seem to miss out on this fantastic feature.
This report describes the experiment instrument and method in details, discusses the problems and limitations encountered and the relation to other works for future work and practitioners.
2. Description of the Experiment
2.1 Introduction and Goals
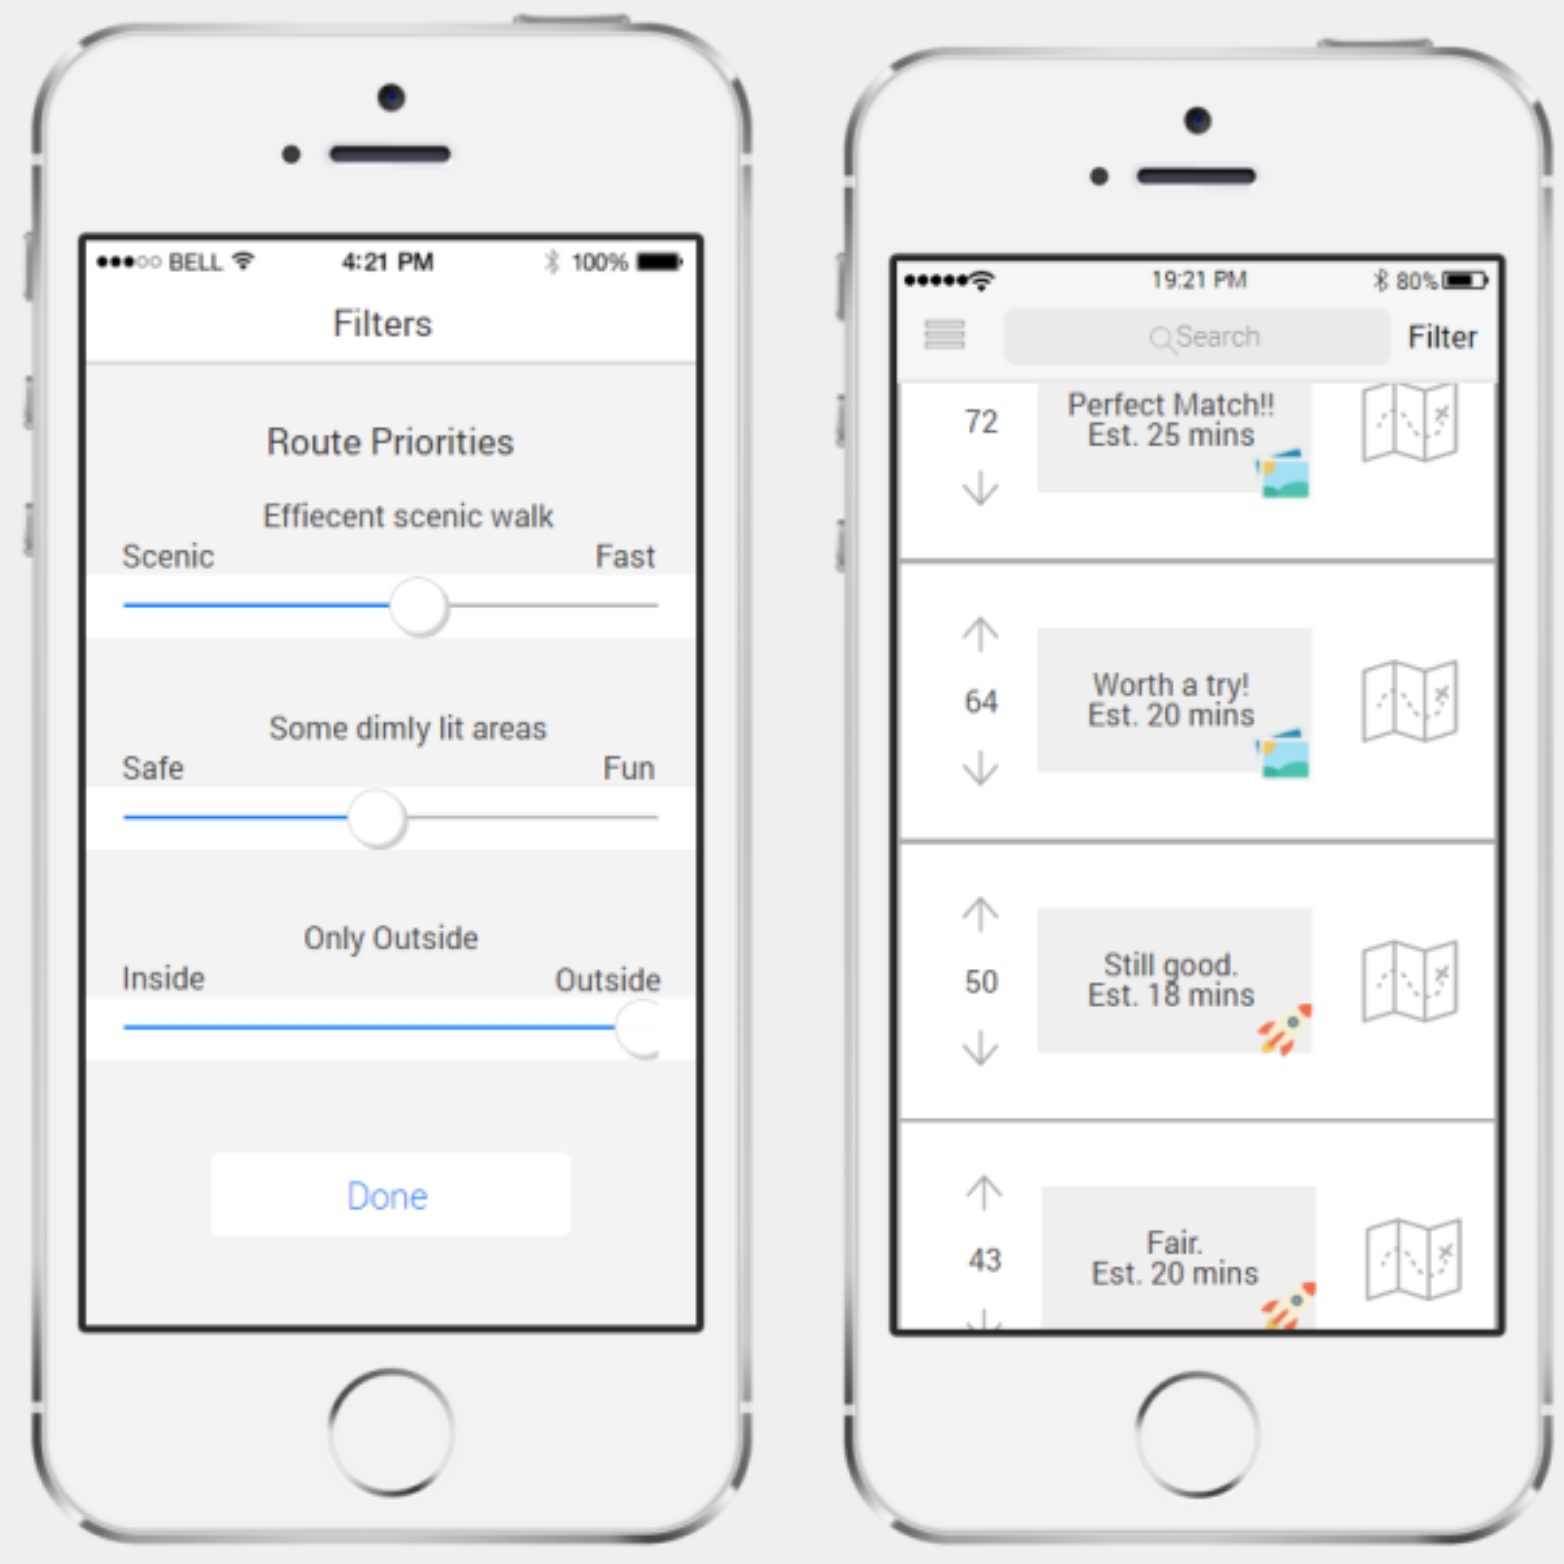
Our prototype focused on discovering alternative routes to a destination. These routes could be in the city, on a hike. They could be on the map, or more than likely the novelty of our solution will be that we want to help users discover routes that may not be on maps. After conducting field study and cognitive walkthrough in milestone II, we learned that potential users may choose their routes on focal points like distance/time, safety and scenery. One of the biggest challenge would be to decide what types of look and feel is the best for our user to quickly and accurately select the route that caters to their needs the best.
Our main goal of the experiment therefore is to determine what filter results should be displayed to maximize user confidence in a route. To further expand our goal we are testing our interface based on two different variations, how the filter percentage results are displayed, and how the best matching filter is displayed. We also had two subgoals:
- To determine if verbal or visual representations in "best filter match" leads to a higher confidence.
- To determine which factor level leads to the quickest user decision.
We believed that percentage report for each specific focal point user can alter in filter together with text should work the best theoretically.
2.2 Methods
2.2.1 Participants
We recruited 10 participants (2-3 participant per group member) not including pilot test. The participants consisted of mainly students over 19 years old, either randomly sampled on UBC campus or recruited through friends. They were given little instructions to begin and didn't fill out any questionnaire. These were representative users even they didn't fully cover the target demographic types.
2.2.2 Conditions
We are comparing which of the following methods/different interface types of showing filter results gives users maximum confidence in a route:
-
Short verbal descriptions (eg. "Perfect match!" or "you can live with it…")
- Plus a little icon for the category it's best matched to (eg. rocket or scenic photo, etc.)
- Or a verbal description of the category it's best matched to (e.g. "scenic", "Fast")
-
Percent match (as a number) for each of the categories (rain cover, speed, scenery, etc.)
- Plus a little icon (same as above)
- Or a verbal description (same as above)
-
Aggregated/combined percent match, as in one big number encompassing a weighted average of the percent match in all categories.
- Plus a little icon (same as above)
- Or a verbal description (same as above)
2.2.3 Tasks
Participants were asked to perform three tasks. All tasks aim to test the main feature of our application which is to quickly find a route based on a set of desired preferences.
Task 1:
Imagine you a UBC student trying to get from your residence in Totem Park to your class in Buchanan A. You are not tight on time so you prefer to take a route that is scenic. Your class is in the middle of the day and it is bright and sunny outside so you don't have much of a preference about safeness or rain cover.
Task 2:
Imagine you are commuting from work place in downtown Vancouver and you want to get to your home in East Hastings. It is 6:30pm and dark outside, it is not raining. You prefer to take a route that is clear of any back-alleys and is properly lit at all times. You are not in a big hurry to get home.
Task 3:
Imagine you are spending the day with your family on Granville Island. You wish to get from the parking lot to the docks and prefer to avoid the crowds indoors. You are not in a hurry and there is no sense of danger around.
2.2.4 Design
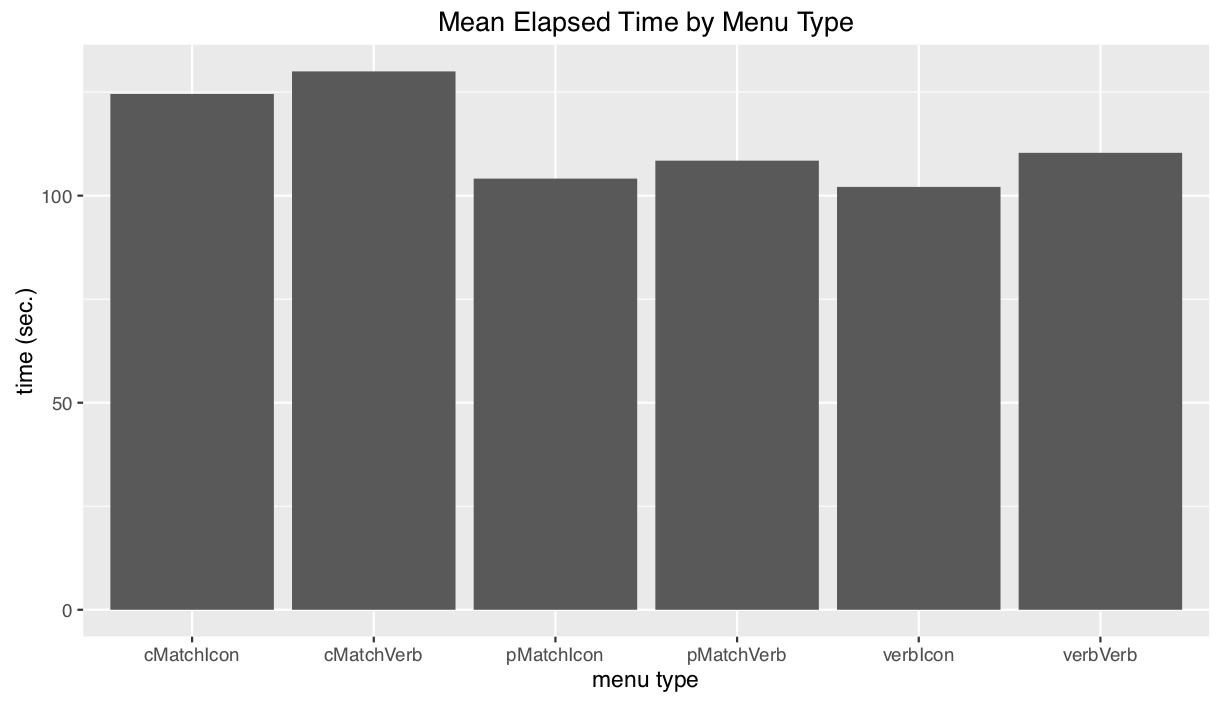
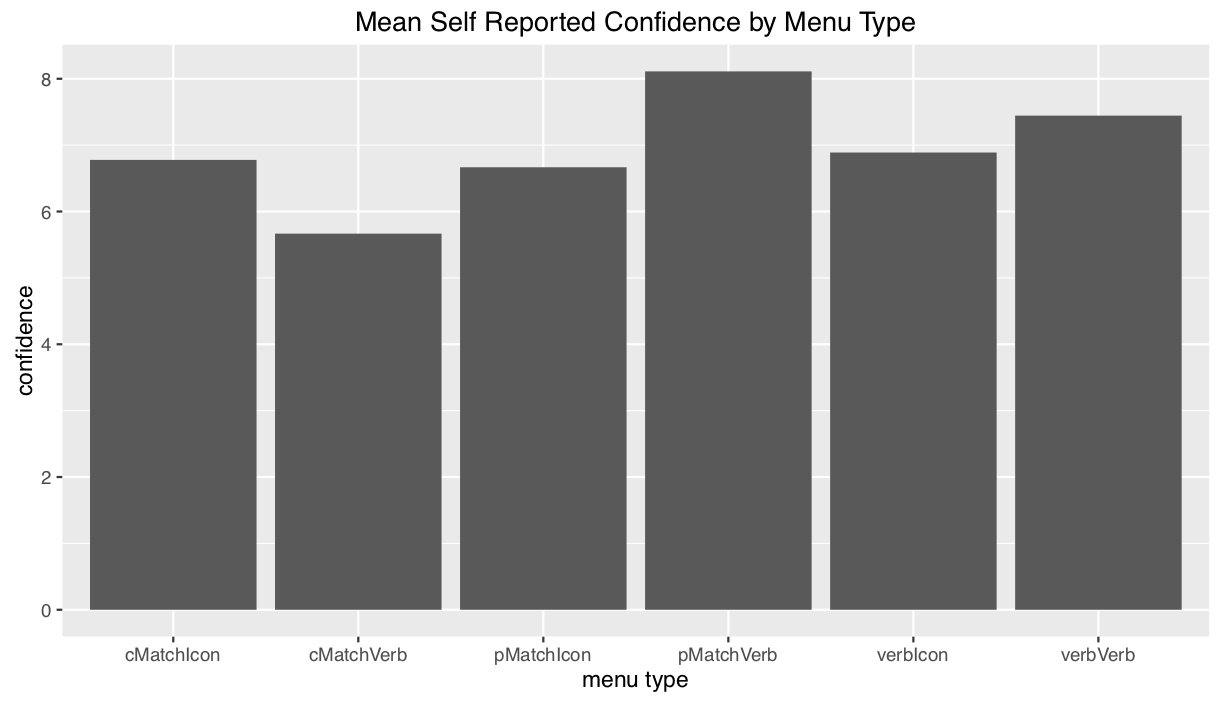
This experiment was conducted using a 1x6 within subject design, with 1 level of expertise and 6 interfaces that were tested. Performance(time) and satisfaction(confidence level) were both measured within subjects. Each participant completed one task on each of the six conditions, for a total of 6 trials. For each trials we looked at three metrics for evaluation: time, error tally and confidence level. We used timer to record time lapses, number of corrections for error tally and participants rating on a scale from 0 - 10 for confidence level.
2.2.5 Variables
- Independent: Methods of showing filter results (short verbal, percent match, aggregated percent match, plus verbal or icon for best match).
- Dependent: Time length, Error tally, User confidence level (on scale 1-10).
Results & Analysis